An Easy Way to Understand Our Economic Situation and the National Debt
If you hate economics and all that financial mumbo-jumbo, this article is for you. Here’s a story that explains the current economic situation in America today.
The Saga of Three Roommates
Tom, Linda and Rick live together in a house and share expenses. Tom is very wealthy; in fact he owns the company for which Linda and Rick work. Tom occupies most of the square footage of the house and earns most of the equity in the house. Consequently, he makes the larger payments on the mortgage.
Over time, unbeknownst to his roommates, Tom starts reducing his contribution to the household mortgage. After some years, he’s paying a much smaller amount of the costs of the house. To compensate for the reduction in monies he contributes, he borrows to make up for the difference, using the house as collateral.
After a while, Linda and Rick are stunned to find that the mortgage on the house is much more than they thought, and their equity worth less. Tom tries to explain that because he’s been able to have higher income and theoretically, invest in his business, Linda and Rick benefit because the business is more profitable, and Linda and Rick are employees. However, neither Linda nor Rick sees a rise in their incomes, and since they do not own the company, they don’t benefit from any profits it may be making.
Tom informs them that to reduce the debt on the house, Linda and Rick should give up some of their equity to pay the mortgage down, borrow from their pension plans, and lower the amount of benefits they get for their health care. In fact, maybe they should give up their pension plans and their health insurance altogether, to pay down that debt.
Tom does not feel any obligation to increase his contributions, even though Linda and Rick have pointed out that if he went back to making the contributions he used to make, they could pay off the debt and the two who have been faithful in their commitments all along, would not suffer.
If you are thinking, “That’s crazy! How could this happen and why are Linda and Rick putting up with this?” your feelings are understandable. This story is analogous to our country’s economic situation at this time.
Now that you’ve read the story, here are the facts and figures behind it:
Wealth has shifted from the average American to corporations and the wealthy over the last 40 years.

In 1970, 62% of aggregate household income earned in America went to middle-income homes, but by 2014 that share had decreased to just 43%.
In 1973, the average CEO’s salary was almost 25 times that of the average worker. In 2021, it grew to over 399 times the salary of the average worker.

Upper income earners saw their share of income raise 47% since 1970, but median income only grew 34% for those with middle-income.
Corporate profits, which fuel the income of the wealthy, have soared. Since 1970, corporate profits before tax have risen from $86.39 billion to $3.46 trillion in 2023. The third quarter of 2022 saw corporate profits hit a record high of $2.08 trillion in the nonfinancial sector, rising $6.1 billion from the previous quarter after growing more than 80% over the past two years. This is during a time when the average American was suffering from higher prices due to inflation, which was in part caused by companies raising their prices significantly above their costs.
Meanwhile, the average American has been increasingly shouldering more of the tax burden, while wealthy people and corporations pay less:

In the 1950s, tax rates for the wealthy peaked at around 91%. In 2017, the top marginal rate sat at about half (39.6%) of what it once was.

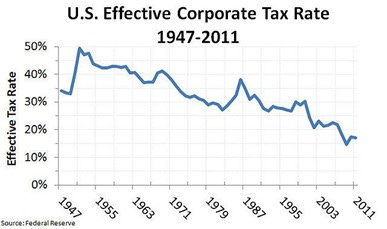
Corporate tax rates were higher than 50% in the 1950s. Now they are down to 21% after the 2017 tax cuts.
After those cuts, businesses accounted for only 7.6% of the $3.5 trillion in federal tax revenue collected in 2018, which dropped further to 6.8% after they were given tax refunds. That 3% decrease in taxes paid by corporations was picked up by individuals. Businesses paid less, while people paid more.
Individuals ended up picking up the tax slack and covering that 3% decrease by contributing 57% of the total tax revenues compared to 54% the year before. The bottom line: businesses pay less while people pay more.
Here are more charts and graphs to tell this story.

Here’s another comparison of how corporate tax rates have dropped over the years, compared to individuals:

Here’s how the corporate tax rate dropped in 60 years:
The National Debt Rises to Cover the Shortfall
While giving tax cuts to corporations and the wealthy, the national debt rose from $250 billion in 1950 to more than $31 trillion at the end of 2022.
Here's how the national debt grew:

So, What is the Solution?
It makes sense to face the reality that individual Americans are losing ground under these failed economic policies, while the wealthy and corporations are benefiting. It makes even more sense to establish higher accountability for the wealthy and corporations to pay their fair share to support America.
Thank you for reading this Fakchex article. Please share this article and join us in the fight to combat disinformation.
Fakchex is the only grassroots communication program that helps people personally combat disinformation. Fakchex presents short, fact-based articles and videos on topics about which there is considerable disinformation, designed for sharing with people who care about these topics, but may not be aware of the facts OR may not have time to research them on their own. Together, we can combat the powerful forces of disinformation that prevent us from coming together to realistically address our problems and opportunities.
This is a FREE program, open to all.
Articles and memes are posted online at: www.Magenta-Nation.com/fakchex
See videos here: www.youtube.com/@magentanation


